8 formulae/advice to judge/trigger the strength of your InstaBlog!

Ever since I stepped into this industry, I always wondered;
Is my InstaBlog actually performing well? How can I judge or rate my performance? What’s the benchmark*?
*unfortunately, the benchmark cannot and should not be a person with a large following – evidently, with time, everyone now knows how easy it is to buy numbers (followers, likes, views, comments, anything)!With a lot of research over the months, I now want to disclose how I have been rating myself all this time (as per industry standards)
1. Formula – How many likes should you receive?
2-3% is a really good amount of likes to get from your total number of followers, but it’s more typical to get between 1-2%.
For e.g. if you have 20,000 followers you must ideally get at least 400 likes per picture. Reality check: Your follower count number of likes you will receive unfortunately ?
Additionally, if you see an influencer/blogger with only around 7000 followers and receiving 1,200+ likes on every single picture (way above the %), chances are, they’re all bought (seeing a lot of this lately)! ?
*A few viral pictures receiving a high % of likes is obviously okay!
2. Formula – What is the engagement rate (ER) you should be aiming at?
Add the average number of “interactions” (likes + comments) you receive in your pictures and divide it by the (number of followers).
A good engagement rate is always between 1.5-3%. Having engagement of only 1% is just okay. If your % is over 4, it is phenomenal!
For e.g. @BarackObama is 2.3% (10,000 comments + 300,000 likes ÷ 13,600,000 followers), @KimKardashian‘s is 2.1% and @NatGeo is 1.4%
Click here to view other celebrities ER
Note: this is a rough average. Not an exact measurement. Your ER will constantly change based on the content you post. But, always use this formula to see how well you perform weekly or monthly (you can even do this per post)!
A silly mistake I’ve been doing – replying to every single comment I receive in my pictures (I tried following the footsteps of other popular bloggers). Now, everyone is doing this. Is this a trend? But why? Who are we kidding? Why should we do that just to show we have a lot of comments?
Brands can see you’re replying aimlessly at everything and anything. At the end of the day, those are YOUR comments. How can that be counted as ‘engagement’ just to increase your ER? I personally don’t think it works that way.

3. Formula – Are your Instastories performing well?
Experts found that ~3.7% of the audience engage with Instagram Stories. That translates to an average of 6.9 times more views than average likes on posts! (*whoop*)
Your % = Number of people who viewed your story, divided by the total number of followers you’ve got and multiply that number by 100.
Now’s the complex bit, what is your “Completion Rate”? (The completion rate lets you know how many people watch your entire story – as that is the main point of your stories)!
 This stat tells you how good your posts are at grabbing and retaining attention. It’s natural to see a bit of drop off after the 1st one. That’s why you have to establish your baseline.
Measure your completion rates for stories over 2 weeks and compare the numbers to see what’s your average completion rate.
Dig into the stories with the highest and lowest completion rates and ask yourself “What drove the engagement? Did you run a specific promotion? Did you host a Q&A that your followers really responded to?”
4. Advices
- Link the Instagram account to Facebook for convenience. Based on statistics, 3% of the Facebook fans will start following you on Instagram and vice versa
- A person will only read 20-28% of the words in your post. Thus, post small and catchy captions!!
- A photo is most active during the first 3 hours. 46.15% of all comments happen within the 1st hour, and 69.23% happen within the first 3 hours. So, if you don’t get traction within the first 3 hours of posting a photo, it is probably not going to gain traction.
- Photos generates 36% more likes than videos
- Retention of followers – only possible if the community is the same (i.e. specific to peoples interests). If there are 5-10 different topics of discussions on one page; users not interested in over 50% of those will unfollow you immediately.
- Represent yourself in your page. E.g. 60% of Nike’s posts in 2014 contained lifestyle content (as opposed to traditional product photos & calls-to-action), while Adidas shared only 32% lifestyle content. Nike saw x8 more interaction on social media (993 shares/post vs Adidas’s 122).
5. Recommendation – for ads
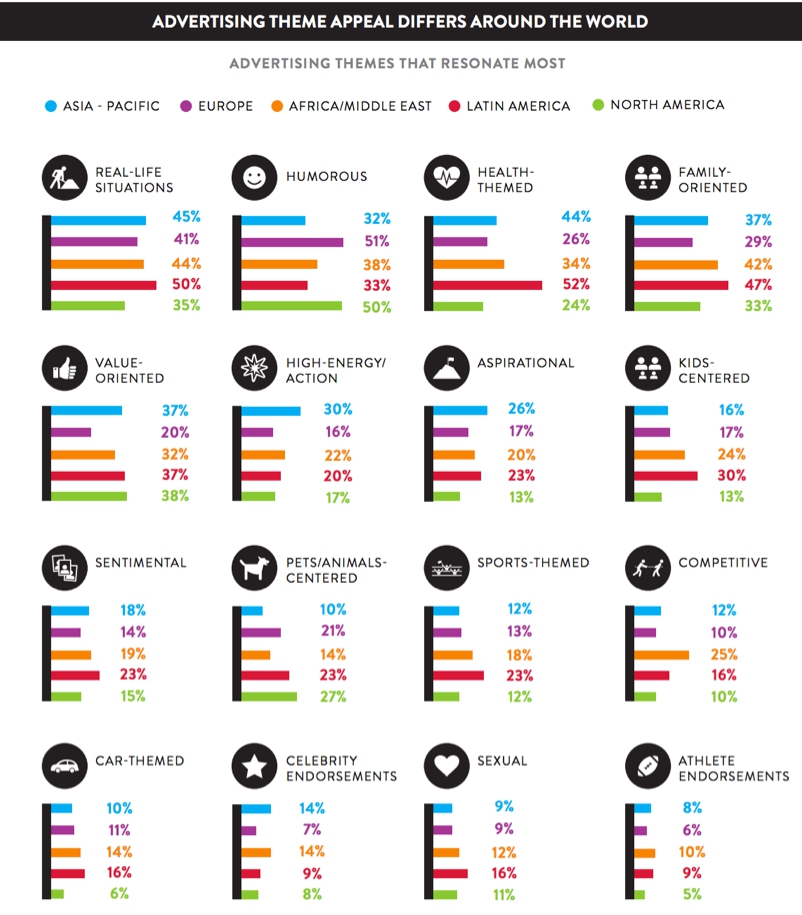
Yes, you obviously must post what YOU like. But consider where you’re living and what the public actually wants? Advertising themes actually differ across the world. See below.

6. Softwares that can be beneficial
- Stop procrastinating! Well… if you’re lazy though, you can schedule your posts with the help of several web-based software’s (e.g. Schedugram or Latergram)
- If you want to analyze your InstaBlog deeper, click here to view other websites that can help you out (a few categories are already available within “Instagram Insights” and most of the software’s are paid – thus found out the above for ya ?)!
7. Images that drive Instagram Engagement
Blue images receive 24% more likes than photos with high concentrations of reds and oranges. Red is commonly associated with immense passion, and that can easily translate to extreme agitation. Blue, on the other hand, is calm, peaceful, and relaxing, which bodes well for users who habitually check their Instagram feeds to blow off some steam from a highly stressful day.
At the end of the day, peaceful things (such as the sky or sea) are blue and help you relax ???
Quick Tip: If you feel your image is too yellow – within the Instagram editing tools, reduce the “warmth” (or “saturation” if it’s that bad) and add “color” (at least “3 to 4” of purple, within “shadow”). However, if there is a particular feed/theme you’re following that works for you, you are your own boss! ??

8. Hashtags are powerful!
The most commonly asked question – How did I become a blogger? Click here to read about my journey.
Few sources on the research above
1, 2, 3, 4, 5, 6, 7, 8, 9, 10
Click here to read my article on which performs better – gallery or individual posts, on Instagram.


